| |
|
||||||||||
Wichtiger Hinweis:
Diese Website wird in älteren Versionen von Netscape ohne graphische Elemente dargestellt. Die Funktionalität der Website ist aber trotzdem gewährleistet. Wenn Sie diese Website regelmässig benutzen, empfehlen wir Ihnen, auf Ihrem Computer einen aktuellen Browser zu installieren. Weitere Informationen finden Sie auf
folgender Seite.
Important Note:
The content in this site is accessible to any browser or Internet device, however, some graphics will display correctly only in the newer versions of Netscape. To get the most out of our site we suggest you upgrade to the latest Netscape.
More information
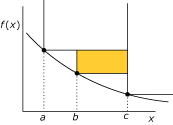
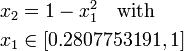
| Formulation: | 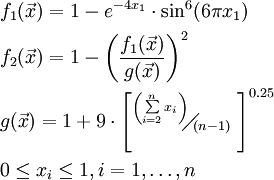 |
|||||||||||||||||||||||||||||||||||||||||||||
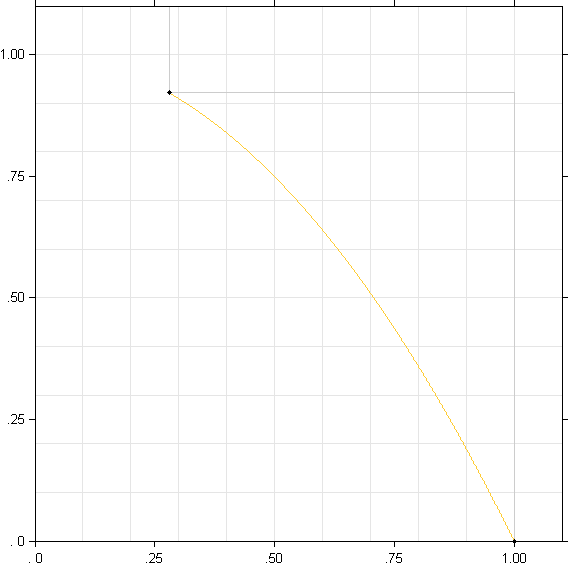
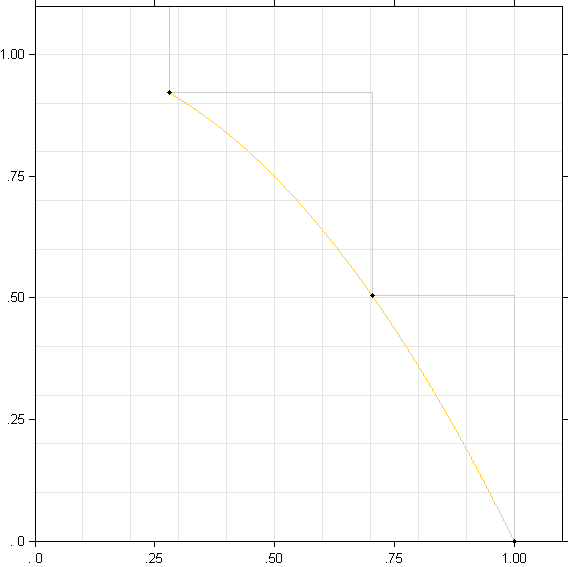
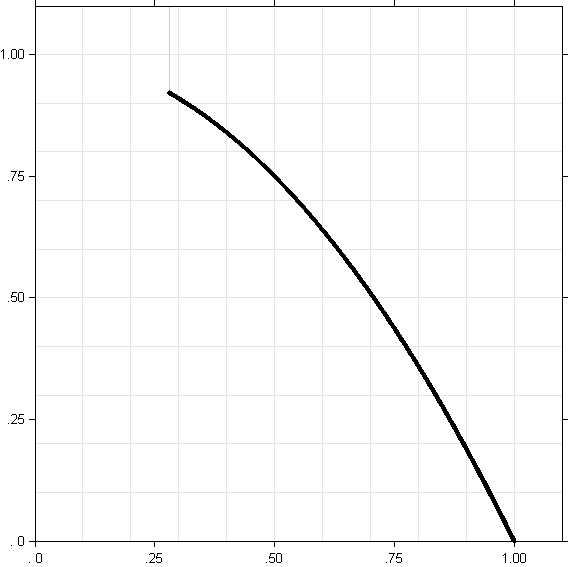
| Pareto Front: |
|
|||||||||||||||||||||||||||||||||||||||||||||
| Relevant Publications: | ||||||||||||||||||||||||||||||||||||||||||||||
| Reference Point: | Reference Point used: |
|||||||||||||||||||||||||||||||||||||||||||||
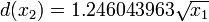
| Density: |
  |
|||||||||||||||||||||||||||||||||||||||||||||
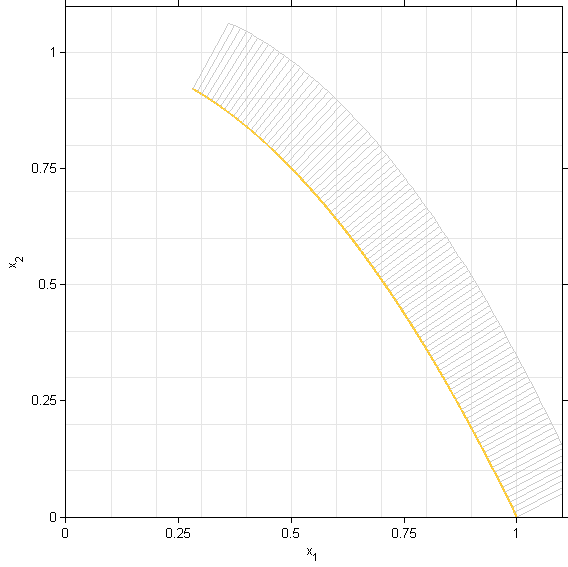
| Optimal Distributions: (see "Maximum Hypervolume" for more plots) |
of 5 points:
 of 10 points:
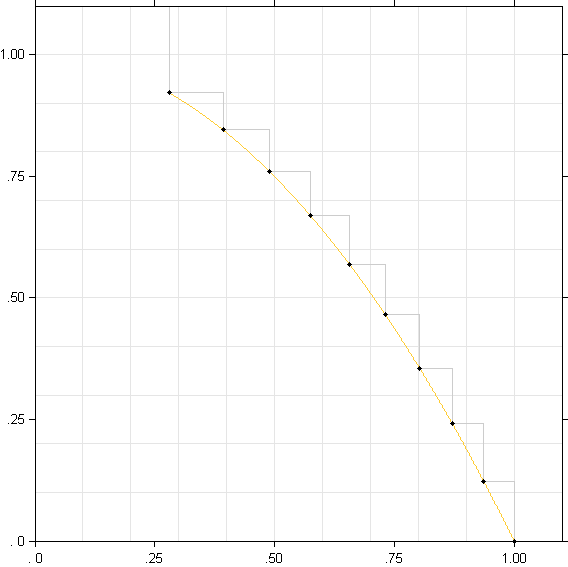 of 20 points:
 of 50 points:  |
|||||||||||||||||||||||||||||||||||||||||||||
| Maximum Hypervolume: |
|
|||||||||||||||||||||||||||||||||||||||||||||
 |
 |

")
